Similarly, I have found that once people embrace the Shannon-Nyquist sampling theorem and its consequent implications, they are reluctant to accept new information that superficially appears to violate the theorem. In this post I hope to explain how the slanted-edge method works, in particular the way that it only appears to violate the Shannon-Nyquist theorem, but really does not. I also circle back to the issue of critical angles discussed in an earlier post, but this time I show the interaction between aliasing and edge orientation angle.
What were we trying to do anyway?
I will assume that you would like to measure the Modulation Transfer Function (MTF) of your optical system, and that you have your reasons.
To obtain the MTF, we first obtain an estimate of the Point Spread Function (PSF); the Fourier Transform of the PSF is the Optical Transfer Function (OTF), and the modulus of the OTF is the MTF we are after. But what is the PSF? Well, the PSF is the impulse response of our optical system, i.e., if you were to capture the image of a point light source, such as a distant star, then the image of your star as represented in your captured image will be a discretely sampled version of the PSF. For an aberration-free in-focus lens + sensor system at a relatively large aperture setting, the bulk of the non-zero part of the PSF will be concentrated in an area roughly the size of a single photosite; this should immediately raise a red flag if you are familiar with sampling theory.
Nyquist-Shannon sampling theory tells us that if our input signal has zero energy at frequencies of F Hertz and higher, then we can represent the input signal exactly using a series of samples spaced 1/(2F) seconds apart. We can translate this phrasing to the image domain by thinking in terms of spatial frequencies, i.e, using cycles per pixel rather than cycles per second (Hertz). Or you could use cycles per millimetre, but it will become clear later that cycles per pixel is a very convenient unit.
If we look at an image captured by a digital image sensor, we can think of the image as a 2D grid of samples with the samples spaced 1 pixel apart in both the x and y dimensions, i.e., the image represents a sampled signal with a spacing of one sample per pixel. I really do mean that the image represents a grid of dimensionless point-sampled values; do not think of the individual pixels as little squares that tile neatly to form a gap-free 2D surface. The fact that the actual photosites on the sensor are not points, but that the actively sensing part of each photosite (its aperture) does approximately look like a little square on some sensors, is accounted for in a different way: rather think of it as lumping the effect of this non-pointlike photosite aperture with the spatial effects of the lens. In other words, the system PSF is the convolution of the photosite aperture PSF and the lens PSF, and we are merely sampling this system PSF when we capture an image. This way of thinking about it makes it clear that the image sampling process can be modeled as a "pure" point-sampling process, exactly like the way it is interpreted in the Nyquist-Shannon theory.
With that out of the way, we can get back to the sampling theorem. Recall that the theorem requires the energy of the input signal to be zero above frequency F. If we are sampling at a rate of 1 sample per pixel, then our so-called Nyquist frequency will be F = 0.5 cycles per pixel. Think of an image in which the pixel columns alternate between white and black --- one such pair of white/black columns is one cycle.
So how do we know if our signal power is zero at frequencies above 0.5 cycles per pixel? We just look at the system MTF to see if the contrast is non-zero above 0.5 cycles per pixel. Note that the system MTF is the combination (product) of the lens MTF, and the photosite aperture MTF. If our photosites are modelled as 100% fill-factor squares, then the photosite aperture MTF is just |sinc(f)|, and if we model an ideal lens that is perfectly focused, then the lens MTF is just the diffraction MTF. I have simulated some examples of such a system using a photosite pitch of 5 micron, light at 550 nm, and apertures of f/4 and f/16, illustrated in Fig 1.
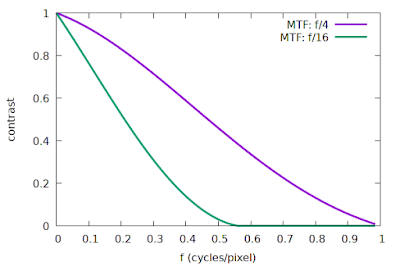 |
| Fig 1: Simulated system MTF curves, ideal lens and sensor |
Interestingly enough, the Nyquist-Shannon sampling theorem does not tell us what will happen if the input signal does not meet the requirement. So what does actually happen? Aliasing, and potentially lots of it. The effect of aliasing can be illustrated in the frequency domain: energy at frequencies above Nyquist will be "folded back" onto the frequencies below Nyquist. But aliasing does not necessarily destroy information; it could just make it hard to tell whether the energy we see at frequency f (for f < Nyquist) should be attributed to the actual frequency f, or whether it is an alias for energy at a higher frequency of 2*Nyquist - f, for example. The conditions under which we can successfully distinguish between aliased and non-aliased frequencies are quite rare, so for most practical purposes we would rather avoid aliasing if we can.
A subtle but important concept is that even though our image sensor is sampling at a rate of 1 sample per pixel, and therefore we expect aliasing because of non-zero contrast at frequencies above 0.5 cycles per pixel, it does not mean that the information at higher frequencies has already been completely "lost" at the instant the image was sampled. The key to understanding this is to realize that aliasing does not take effect at the time of sampling our signal: aliasing only comes into play when we start to reconstruct the original continuous signal, or if we want to process the data in a way that implies some form of reconstruction, e.g., computing an FFT. A trivial example might illustrate this argument: Consider that we have two analogue to digital converters (ADCs) simultaneously sampling an audio signal at a sample rate of 4 kHz each. If we offset the timing of the second ADC with half the sampling period (i.e., 1/8000 s) relative to the first ADC, then we have two separate sets of samples each with a Nyquist limit of 2 kHz. If we combine the two sets of samples, we find that they interleave nicely to give us an effective sampling period of only 1/8000 s, so that the combined set of samples now has a higher Nyquist limit of 4 kHz. Note that sampling at 4 kHz did not harm the samples from the individual ADCs in any way; we can combine multiple lower-rate samples at a later stage (under the right conditions) to synthesize a higher-rate set of samples without contradicting the Nyquist-Shannon sampling theorem. The theorem does not require all the samples to be captured in a single pass by a single sampler. This dual ADC example illustrates the notion that the Nyquist limit does not affect the capture of the samples themselves, but rather comes into play with the subsequent reconstruction of a continuous signal from the samples.
Normally, this subtle distinction is not useful, but if we are dealing with a strictly cyclical signal, then it allows us to combine samples from different cycles of the input signal as if they were sampled from a single cycle. An excellent discussion of this phenomenon can be found in this article, specifically the sections titled "Nyquist and Signal Content" and "Nyquist and Repetitive Signals". That article explains how we can sample the 60 Hz US power line signal with a sample rate of only 19 Hz, but only because of the cyclic nature of the input signal. This technique produces a smaller effective sample spacing, which is accomplished by re-ordering the 19 Hz samples, captured over multiple 60 Hz cycles, to reconstruct a single cycle of the 60 Hz signal. The smaller effective sample spacing obtained in this way is sufficiently small, according to the Nyquist-Shannon theorem, to adequately sample the 60 Hz signal.
We can design a similar technique to artificially boost the sampling rate of a 2D image. First, imagine that we captured an image of a perfectly vertical knife-edge target, like this:
 |
| A perfectly vertical knife-edge image, magnified 4x here |
We can plot the intensity profile of the first row of pixels, as a function of column number, like this:
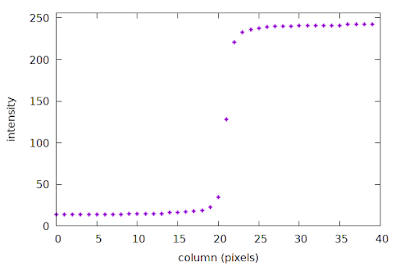 |
| An example of a discretely sampled ESF |
But what about the next row in this image? It is essentially another set of samples across the edge, i.e., another set of ESF samples. In fact, if we assume that the region of interest (ROI) represented by the image above is small enough, we can pretend that the system MTF is constant across the entire ROI, i.e., the second row is simply another "cycle" of our cyclical signal. Could we also employ the "spread your low-rate samples across multiple cycles" technique, described above in the context of power line signals? Well, the problem is that our samples are rigidly spaced on a fixed 2D grid, thus it is impossible to offset the samples in the second row of the image, relative to the first, which is required for that technique. What if we moved the signal in the second row, rather than moving the sampling locations?
This is exactly what happens if we tilt our knife-edge target slightly, like this:
 |
| A slanted knife-edge image, magnified 4x |
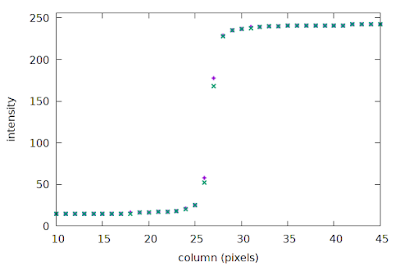 |
| Sparse ESFs of rows 1 and 0 of the slanted edge image |
This approach creates the conditions under which we can use a low sampling rate to build a synthetic set of samples, constructed over multiple cycles, with a much smaller effective sample spacing. The details of how to implement this are covered in the next two sections.
To recap: the slanted-edge method takes a set of 2D image samples, and reduces it to a set of more closely spaced samples in one dimension (the ESF), effectively increasing the sampling rate. There are some limitations, though: some angles thwart our strategy, and we will end up with some unrecoverable aliasing. To explain this phenomenon, I will first have to explain some implementation details of the slanted-edge method.
The slanted-edge method
I do not want to describe all aspects of the slanted-edge method in great detail in this post, but very briefly, the major steps are:
- Identify and model the step edge in the Region Of Interest (ROI);
- Construct the irregularly-spaced oversampled Edge Spread Function (ESF) with the help of the edge model;
- Construct a regularly-spaced ESF from the irregularly-spaced ESF;
- Take the derivative of the ESF to obtain the Line Spread Function (LSF);
- Compute the FFT of the LSF to obtain the Modulation Transfer Function (MTF);
- Apply any corrections to the MTF (derivative correction, kernel correction if necessary).
Today I will focus on steps 2 & 3.
Constructing the ESF
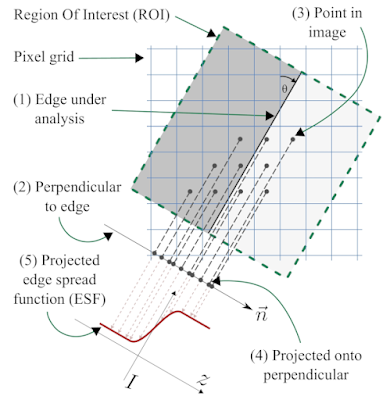 |
| Fig 2: The slanted-edge method, following Khom's description |
We start with a region of interest (ROI) that is defined as a rectangular region of the image aligned with the edge orientation, as shown in Fig 2. We use the orientation of the edge-under-analysis (1) to estimate θ, the edge angle, which is used to construct a unit vector that is normal (perpendicular) to the edge (2), called n. Now we take the (x, y) coordinates of the centre of each pixel (3), and project them onto the normal vector n (4) to obtain for each pixel i its signed distance to the edge, represented by di. The intensity of pixel i is denoted Ii, and we form a tuple (di, Ii) to represent the projection of pixel i onto the normal n. If we process all the pixels i inside the ROI, we obtain the set of tuples ESFirregular = {(di, Ii)}, our dense-but-irregularly spaced ESF (5).
We can see quite clearly in Fig 2 that even though the original 2D pixel centres have a strict spacing of one sample per pixel-pitch, the projection onto the normal vector n produces a set of 1D samples with a much finer spacing. Consider a concrete example with θ = 7.125°, producing a line slope of 1/8 with respect to the vertical axis, as illustrated in Fig 2; this means the vector n can be written as (-1, 8)/√(-12 + 82), or n = (-1, 8)/√65. If we take an arbitrary pixel p = (x, y), we can project it onto the normal n by first subtracting the coordinates of a point c that falls exactly on the edge, using the well-know formula involving the vector dot product to yield the scalar signed-distance-from-edge d such that
If we substitute our concrete value of n and expand this formula, we end up with the expression d = (8y - x)/√65 + C, where C = c · n is simply a scalar offset that depends on exactly where we chose to put c on the edge. If we let k = 8y - x, where both x and y are integers (we can choose our coordinate frame to accomplish this), then d = k/√65 + C, or after rearranging, d - C = k/√65.We can see quite clearly in Fig 2 that even though the original 2D pixel centres have a strict spacing of one sample per pixel-pitch, the projection onto the normal vector n produces a set of 1D samples with a much finer spacing. Consider a concrete example with θ = 7.125°, producing a line slope of 1/8 with respect to the vertical axis, as illustrated in Fig 2; this means the vector n can be written as (-1, 8)/√(-12 + 82), or n = (-1, 8)/√65. If we take an arbitrary pixel p = (x, y), we can project it onto the normal n by first subtracting the coordinates of a point c that falls exactly on the edge, using the well-know formula involving the vector dot product to yield the scalar signed-distance-from-edge d such that
d = (p - c) · n.
This implies that d - C is an integer multiple of 1/√65 ≈ 0.12403, meaning that the gaps between consecutive di values in ESFirregular must be approximately 0.12403 times the pixel pitch. We have thus transformed our 2D image samples with a spacing of 1 pixel pitch into 1D samples with a spacing of 0.12403 times the pixel pitch, to achieve roughly 8× oversampling.
The spacing of our oversampled ESF can indeed support a higher sampling rate, e.g. 8× as shown in the previous paragraph. This means that the Nyquist limit of our 8× oversampled ESF is now 4 cycles/pixel, compared to the original 0.5 cycles/pixel of the sampled 2D image, effectively allowing us to reliably measure the system MTF at frequencies between 0.5 cycles/pixel and 1.0 cycles/pixel (and higher!), provided of course that our original system MTF had zero energy at frequencies above 4 cycles/pixel. For typical optical systems, this 4 cycles/pixel limit is much more realistic compared assuming zero contrast above the sensor Nyquist limit of 0.5 cycles/pixel.
The argument presented here to show how the slanted-edge projection yields a more densely-spaced ESF holds for most, but not all, angles θ in the range [0, 45]. We typically take the irregularly spaced ESFirregular and construct from it a regularly spaced ESF at a convenient oversampling factor such as 8× so that we can apply the FFT algorithm at a later stage (recall that the FFT expect a regular sample spacing). The simplest approach to producing such a regular spacing is to simply bin the values in ESFirregular into bins with a width of 0.125 times the pixel pitch; we can then analyse this binning to determine which specific angles cause problems.
Revisiting the critical angles
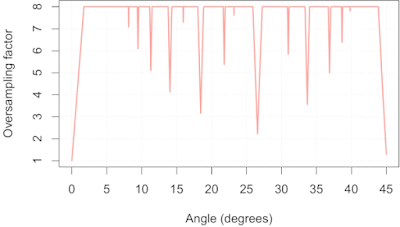
Above I have shown that you can attain 8× oversampling at an edge orientation angle of θ = 7.1255°. But what about other angles? In a previous blog post I attempted to enumerate the problematic angles, but I could not come up with a foolproof way to list them all. Instead, we can follow the empirical approach taken by Masaoka, and simply step through the range 0° to 45° in small increments. At each angle we can attempt to bin the irregular ESF into an 8× oversampled regular ESF. For some angles, such as 45°, we already know that consecutive di will be exactly 1/√2 ≈ 0.70711 times the pixel pitch apart, leaving most of the 8× oversampling bins empty. The impact of this is that the effective oversampling factor will be less than 8.
How can we estimate the effective oversampling factor at a given edge orientation angle? To keep things simple, we will just look at di values in the range [0, 1) since we expect this to be representative of all intervals of length 1 (near the edge --- at the extremes of the ROI samples will be more sparse). We divide this interval into 8 equal bins of 0.125 pixels wide, and we take all the samples of ESFirregular such that 0 ≤ di < 1, and bin them while keeping track which of the 8 bins received samples, which I'll call the non-empty bins. The position of the edge relative to the origin of our pixel grid (what Masaoka called the "edge phase") will influence which of the 8 bins receive samples when we are simulating certain critical angles. For example, at an edge angle of 45° and an edge phase of zero we could expect two non-empty bins, since the consecutive di values might be (0, 0.70711, 1.4142, ...). If we had an edge phase of 0.5, then we would have only one non-empty bin because the consecutive di values might be (0.5, 1.2071, 1.9142, ...). A reasonable solution is to sweep the edge phase through the range [0, 1) in small increments, say 1000 steps, while building a histogram of the number of non-empty bins. We can then calculate the mean effective oversampling factor (= mean number of non-empty bins) directly from this histogram, which is shown in Fig 3:
How can we estimate the effective oversampling factor at a given edge orientation angle? To keep things simple, we will just look at di values in the range [0, 1) since we expect this to be representative of all intervals of length 1 (near the edge --- at the extremes of the ROI samples will be more sparse). We divide this interval into 8 equal bins of 0.125 pixels wide, and we take all the samples of ESFirregular such that 0 ≤ di < 1, and bin them while keeping track which of the 8 bins received samples, which I'll call the non-empty bins. The position of the edge relative to the origin of our pixel grid (what Masaoka called the "edge phase") will influence which of the 8 bins receive samples when we are simulating certain critical angles. For example, at an edge angle of 45° and an edge phase of zero we could expect two non-empty bins, since the consecutive di values might be (0, 0.70711, 1.4142, ...). If we had an edge phase of 0.5, then we would have only one non-empty bin because the consecutive di values might be (0.5, 1.2071, 1.9142, ...). A reasonable solution is to sweep the edge phase through the range [0, 1) in small increments, say 1000 steps, while building a histogram of the number of non-empty bins. We can then calculate the mean effective oversampling factor (= mean number of non-empty bins) directly from this histogram, which is shown in Fig 3:
 |
| Fig 3: Mean effective oversampling factor as a function of edge orientation |
What can we do with this information? Well, if we know our system MTF is zero above 0.5 cycles/pixel, then we can actually use the slanted-edge method safely on a 45° slanted edge, as I will show below. Similarly, using an edge at an angle near 26.565° is only a problem if our system MTF is non-zero above 1 cycle/pixel. Alternatively, we could decide that we require a minimum oversampling factor of 4×, thus allowing us to measure system MTFs with cut-off frequencies up to 2 cycles/pixel, and use Fig 3 to screen out edge angles that could lead to aliasing, such as 0°, 18.435°, 33.690°, 26.565° and 45°.
What aliasing looks like when using the slanted-edge method
This post is already a bit longer than I intended, but at the very least I must give you some visual examples of what aliasing looks like. Of course, to even be able to process edges at some of the critical angles requires a slanted-edge implementation that deals with the issue of empty bins, or perhaps an implementation that adapts the sampling rate to the edge orientation. MTF Mapper, and particularly the newer "loess" mode introduced in 0.7.16, does not bat an eye when you feed it a 45° edge.
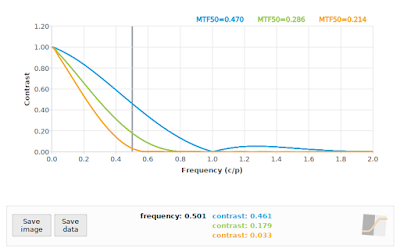
A 45° edge angle will give us di values with a relative spacing in multiples of √0.5, so our effective sampling rate is approximately 0.70711 samples per pixel pitch, giving us a sampling frequency of 1/√0.5 ≈ 1.4142, with a resulting Nyquist frequency of 0.70711. But first I will show you the SFR of three simulated systems at f/4, f/11 and f/16 under ideal conditions (perfect focus, diffraction only, no image noise) at a simulated edge angle of 5° so that you can see approximately what we expect the output to look like:
A 45° edge angle will give us di values with a relative spacing in multiples of √0.5, so our effective sampling rate is approximately 0.70711 samples per pixel pitch, giving us a sampling frequency of 1/√0.5 ≈ 1.4142, with a resulting Nyquist frequency of 0.70711. But first I will show you the SFR of three simulated systems at f/4, f/11 and f/16 under ideal conditions (perfect focus, diffraction only, no image noise) at a simulated edge angle of 5° so that you can see approximately what we expect the output to look like:
 |
| Fig 4: Reference SFR curves at 5°. Blue=f/4, Green=f/11, Orange=f/16 |
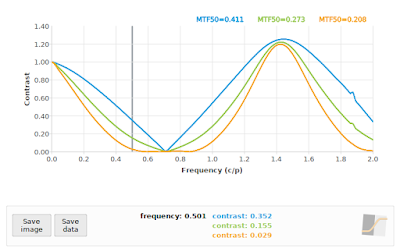
Fig 4 is the baseline, or what we would expect if our sampling rate was high enough. Note that the f/4 curve in particular has a lot of non-zero contrast above 0.70711 cycles/pixel, so we should be prepared for some aliasing at critical angles. If we process the 45° case with the default MTF Mapper algorithm (or "kernel" in version 0.7.16 and later) then we obtain Fig 5. This is rather more exciting that we hoped for.
 |
| Fig 5: MTF Mapper "kernel" SFR curves at 45°. Blue=f/4, Green=f/11, Orange=f/16 |
 |
| Fig 6: MTF Mapper "loess" SFR curves at 45°. Blue=f/4, Green=f/11, Orange=f/16 |
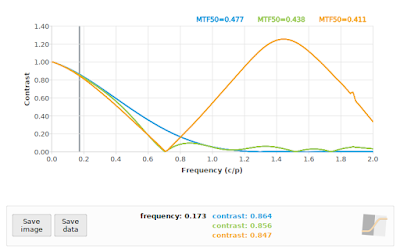 |
| Fig 7: f/4: Comparing "loess" algorithm at 45° (green), and "kernel" algorithm at 45° (orange) to reference 40° (blue) |
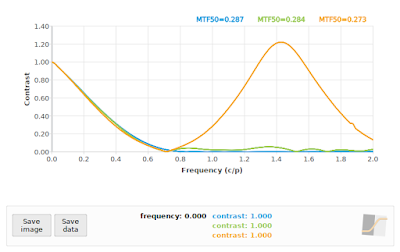 |
| Fig 8: f/11: Comparing "loess" algorithm at 45° (green), and "kernel" algorithm at 45° (orange) to reference 40° (blue) |
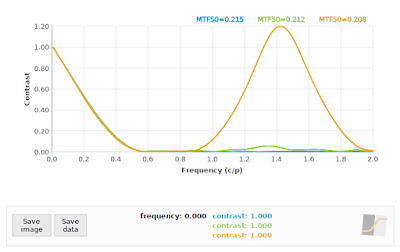 |
| Fig 9: f/16: Comparing "loess" algorithm at 45° (green), and "kernel" algorithm at 45° (orange) to reference 40° (blue) |
Does this mean that we should allow 45° edge angles? Well, they will not break MTF Mapper, and they can produce accurate enough results if our system is bandlimited (zero contrast above 0.71 c/p), but I would still avoid them; it is just not worth the risk of aliasing. As such, the MTF Mapper test charts will steer clear of 45° edge angles.
What about our second-worst critical angle at 26.565°? A quick comparison at f/4 using the "loess" algorithm vs a 22° edge angle is shown in Fig 10.
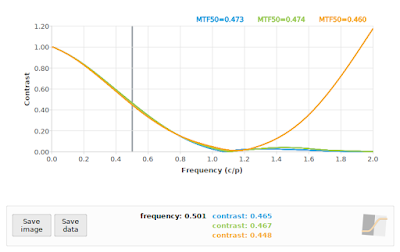 |
| Fig 10: f/4: Comparing "loess" algorithm at 26.565° (green), and "kernel" algorithm at 26.565° (orange) to reference 22° (blue) |
Unfortunately the story does not end here. Recall that MTF Mapper has the ability to use a subset of the Bayer channels to perform a per-channel MTF analysis. We can pretend that the grayscale images we have been using so far is a Bayer mosaic image, and process only the green and red subsets, as shown in Fig 11.
If you really want to see the wheels come off, you can process a 45° angled edge using only the Red Bayer subset, as shown in Fig 12. As a general rule, the SFR/MTF curve should decrease with increasing frequency. There are exceptions to this rule: 1) we know that if the impact of diffraction is relatively low, such as with an f/4 aperture on a 5 micron photosite pitch sensor, then we expect the curve to bounce back after 1 cycle/pixel owing to the photosite aperture MTF, and 2) when we are dealing with a severely defocused MTF we can expect multiple bounces. Incidentally, these bounces are actually phase inversions, but that is a topic for another day. Even in these exceptional cases, we expect a generally decreasing envelope to the curve, so if you see something like Fig 12, you should know that something is amiss.
Wrapping up
We have looked closely at how the ESF is constructed in the slanted-edge method, and how this effectively reduces the sample spacing to allow us to reliably measure the SFR at frequencies well beyond the Nyquist rate of 0.5 cycles/pixel implied by the photosite pitch. Unfortunately there are a handful of critical angles that have poor geometry, leading to a much lower than expected effective oversampling factor. At these critical angles, the slanted-edge method will still alias badly if the system MTF has non-zero contrast above the Nyquist frequency specific to that critical angle.
If you are absolutely certain that your system MTF has a sufficiently low cut-off frequency, such as when using large f-numbers or very small pixels, then you can safely use any edge orientation above about 1.7°. I would strongly suggest, though, that you rather stick to the range (1.73, 43.84) degrees, excluding the range (26.362, 26.773) degrees to avoid the second-worst critical angle. It would also be prudent to pad out these bounds a little to allow for a slight misalignment of your test chart / object.
I guess it is also important to point out that for general purpose imaging, your effective sample spacing will remain at 1 sample per pixel, and aliasing will set in whenever your system MTF has non-zero contrast above 0.5 cycles/pixel. The slanted-edge method can be used to measure your system MTF to check if aliasing is likely to be significant, but it will not help you to avoid or reduce aliasing in photos of subjects other than slanted-edge targets.
I guess it is also important to point out that for general purpose imaging, your effective sample spacing will remain at 1 sample per pixel, and aliasing will set in whenever your system MTF has non-zero contrast above 0.5 cycles/pixel. The slanted-edge method can be used to measure your system MTF to check if aliasing is likely to be significant, but it will not help you to avoid or reduce aliasing in photos of subjects other than slanted-edge targets.
Lastly, this article demonstrated the real advantage of using the newer "loess" algorithm that has been added to MTF Mapper. The new algorithm is much better at handling aliased or near-aliased scenarios, without giving up any accuracy on the general non-aliased scenarios.
Acknowledgements
I would like to thank DP Review's forum members, specifically Jack Hogan and JACS, for providing valuable feedback on earlier drafts of this post.
Wow! This is a great description of the Slanted Edge Method and the LOESS algorithm. It will take a few more reads to fully ingest the details but after the first read I fully grasp the concept because you have structured the post so very well.
ReplyDelete